

Every user who opens your app today has a purchase intent score. You just can't see it.
We spend enormous energy optimizing the paywall itself — the copy, the design, the pricing, the trial length. Almost none are deciding who should see it in the first place.
Not all users arrive at your paywall with the same intent.
One downloaded your app, ready to subscribe on day one. Another was curious, clicked around, and had no real intention of paying.
Your paywall looks the same to both. Your analytics averages them together.
That's exactly the gap Demand Score closes.
What Demand Score is
Demand Score is a 1–100 value Superwall assigns to every user on every app open. It represents their likelihood to convert. The higher the score, the higher the purchase intent. It's generated from device-level signals: device model, OS version, device age, App Store country, connection type, number of app opens, and paywall views. The model is trained on hundreds of millions of real-world data points across the Superwall network.
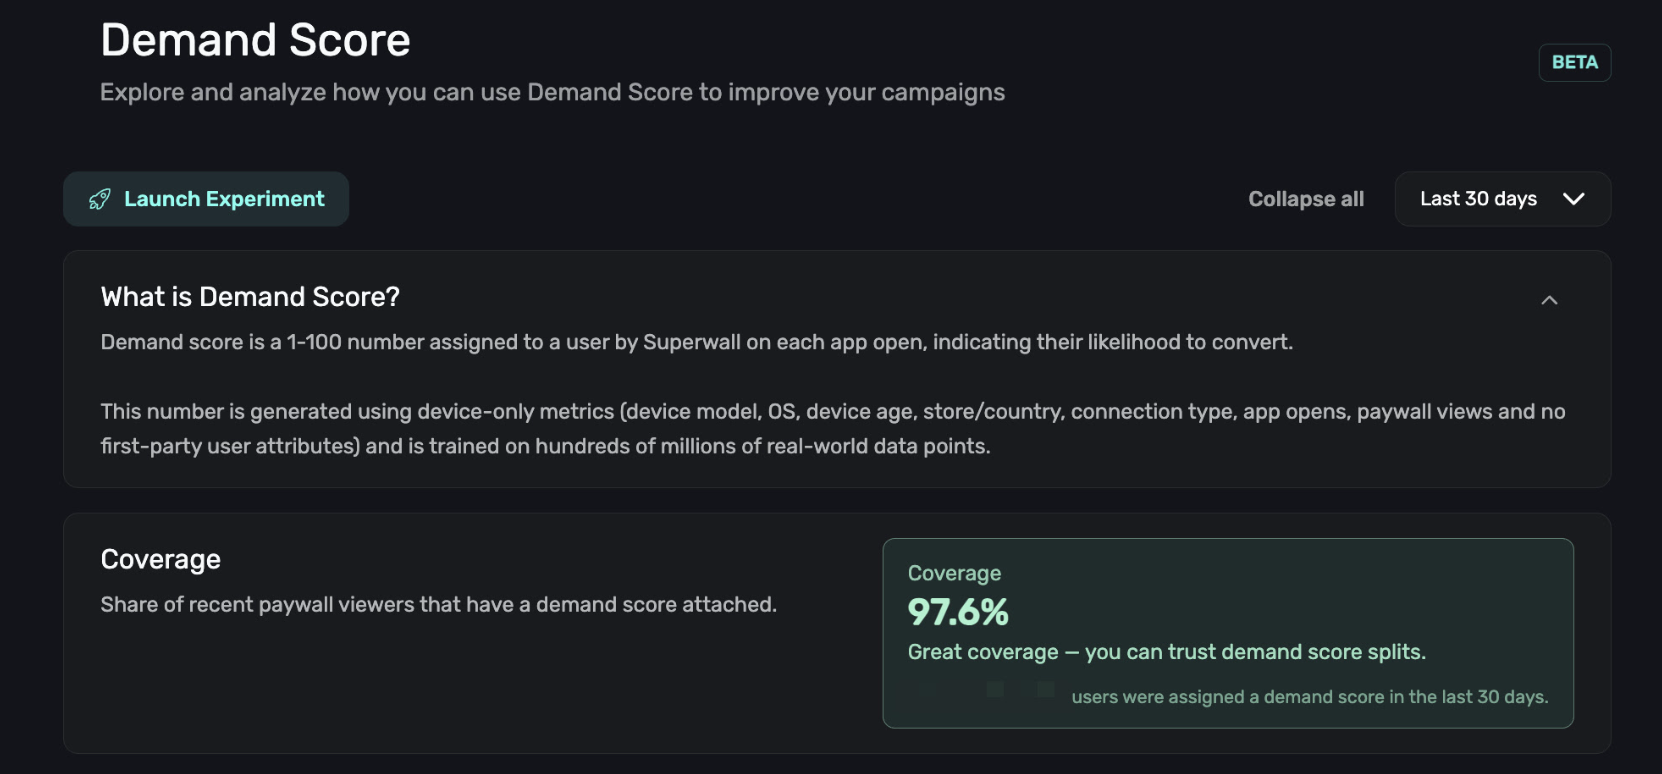
There's nothing to configure. No SDK changes, no custom events. It works out of the box.
What it shows you
Open the Demand Score page in your dashboard and you'll see things most subscription apps have never had visibility into before.
1. Conversion by intent level
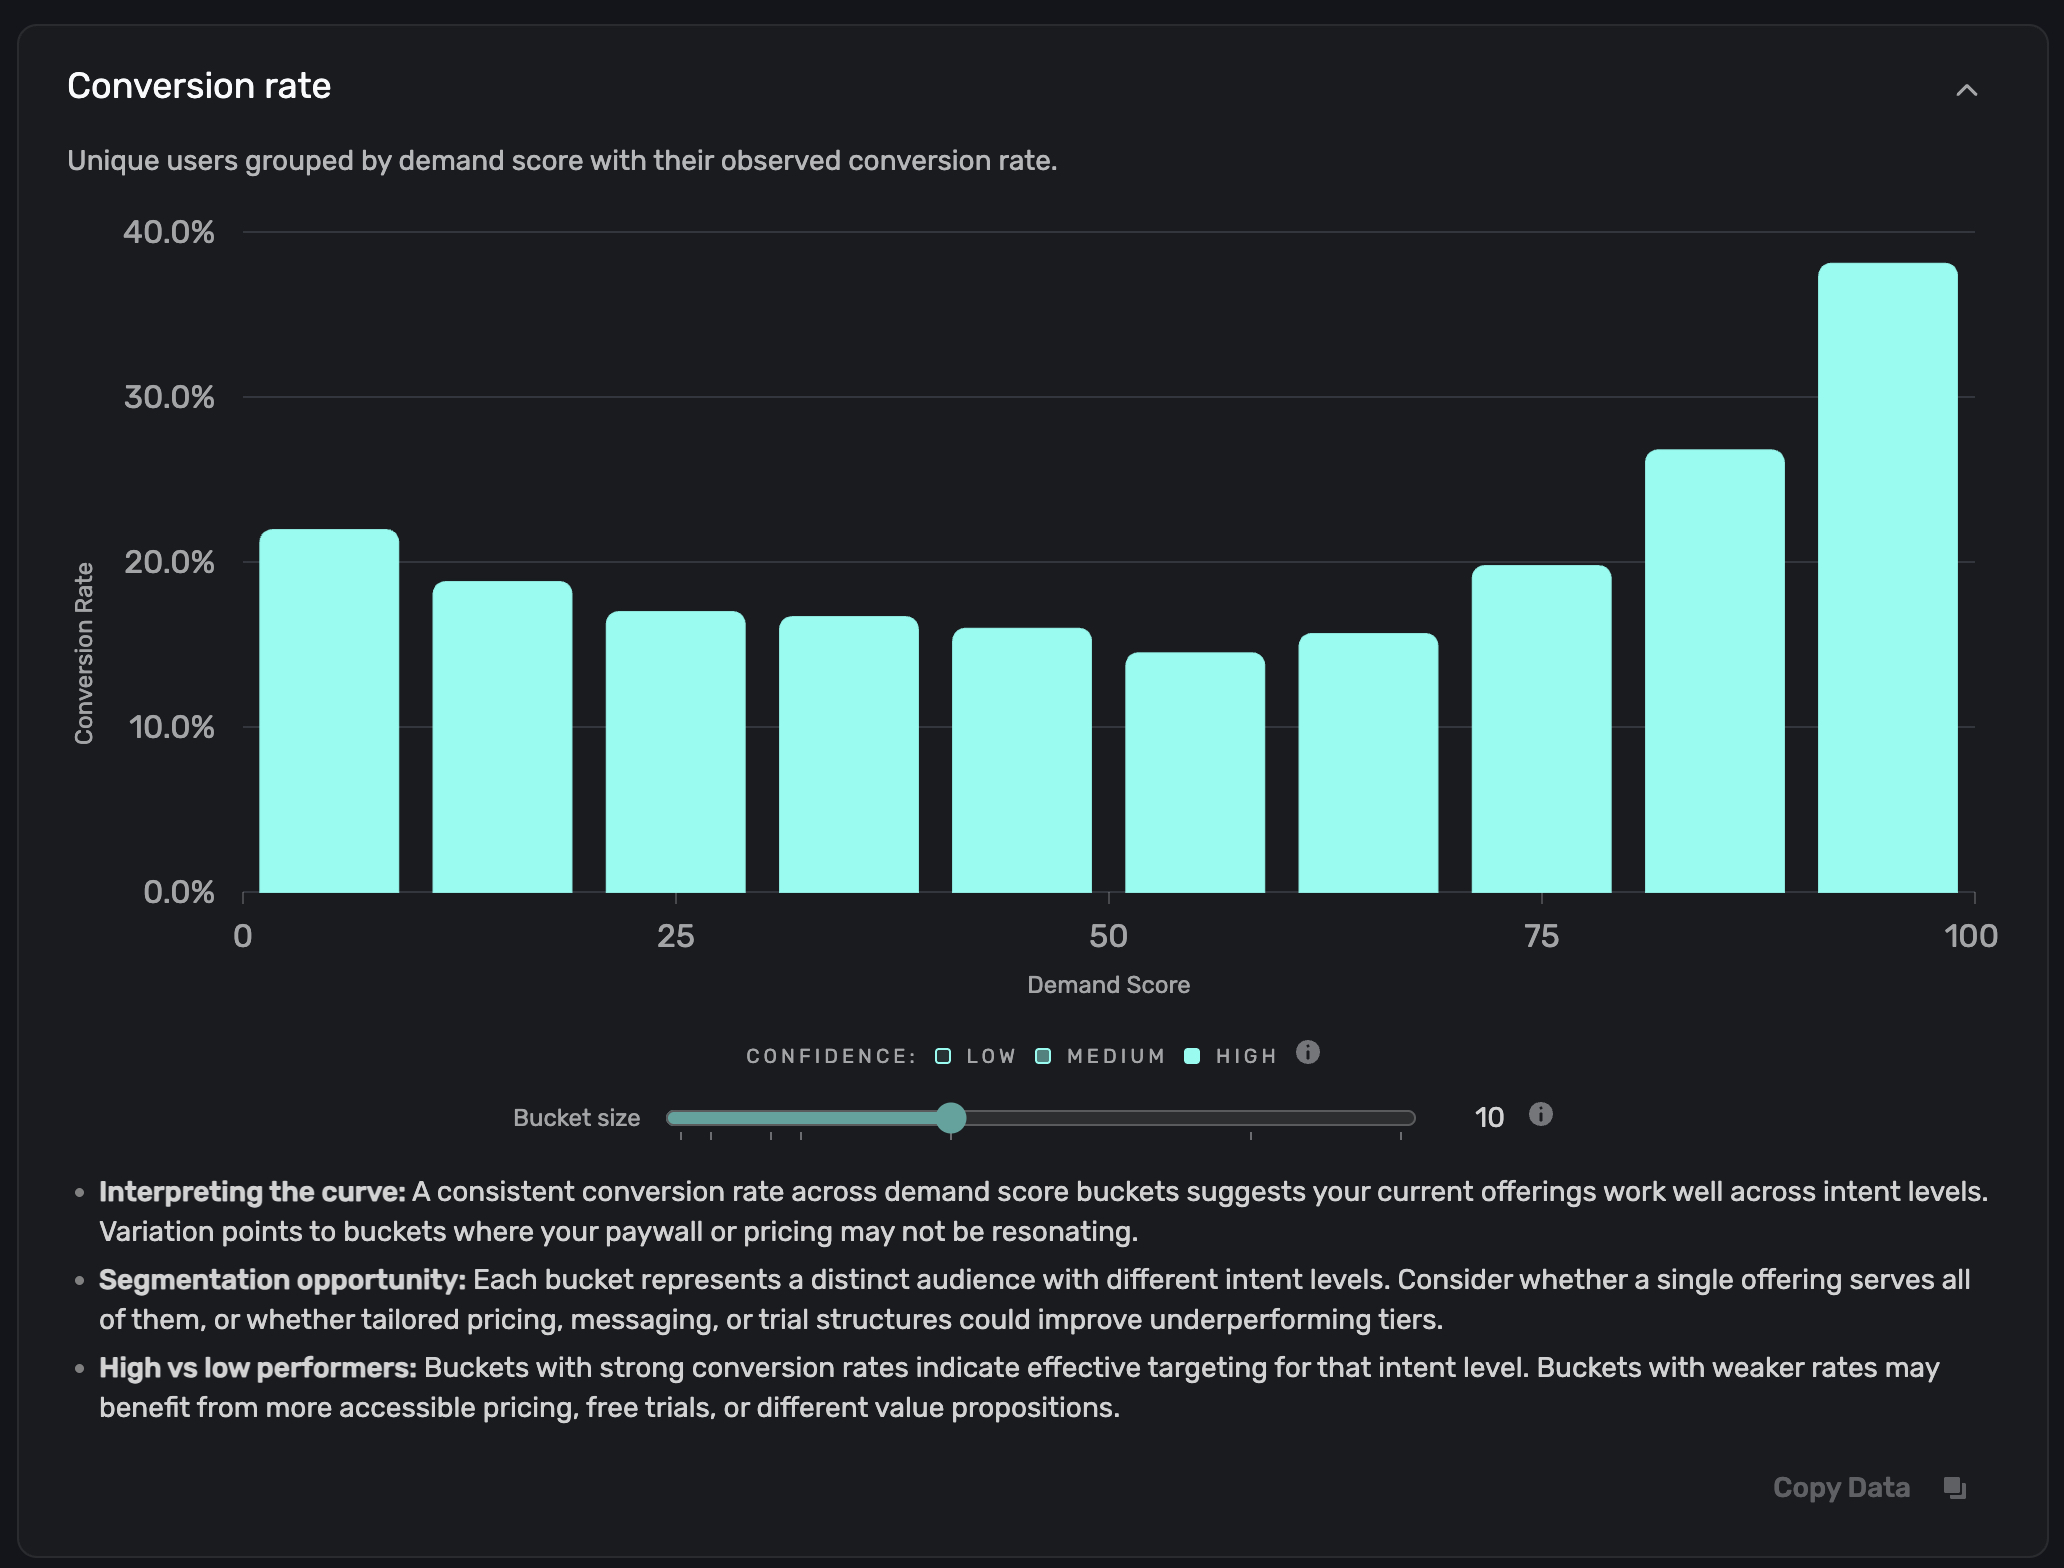
A chart showing how the conversion rate varies across score buckets.
For most apps, conversion rises with demand score. But how it rises — and where it jumps — matters.
A clear step change at 70 might signal your natural "ready to pay" threshold. A flat line across buckets might mean your paywall has an offer problem, not a user quality problem.
The distinction changes what you test next.
2. Volume distribution
Where are your paywalled users actually concentrated?
If most of your volume sits in the 40–60 range, you're working with a largely mid-intent audience. That changes how you think about pricing tiers, trial length, and what to prioritize in experiments.
One pattern worth watching for is a distribution that splits into two clusters rather than forming one smooth curve.
A high-intent group at the top — power users who know exactly what they want. And a separate, larger cluster in the 50–65 range — engaged, but not converting at your current price.
That second cluster is usually invisible in standard analytics.
When you see it, the question changes. It's not "why aren't these users converting at $15?" It might be "Should this segment even see the $15 offer?"
3. Trial outcomes and billing patterns by segment
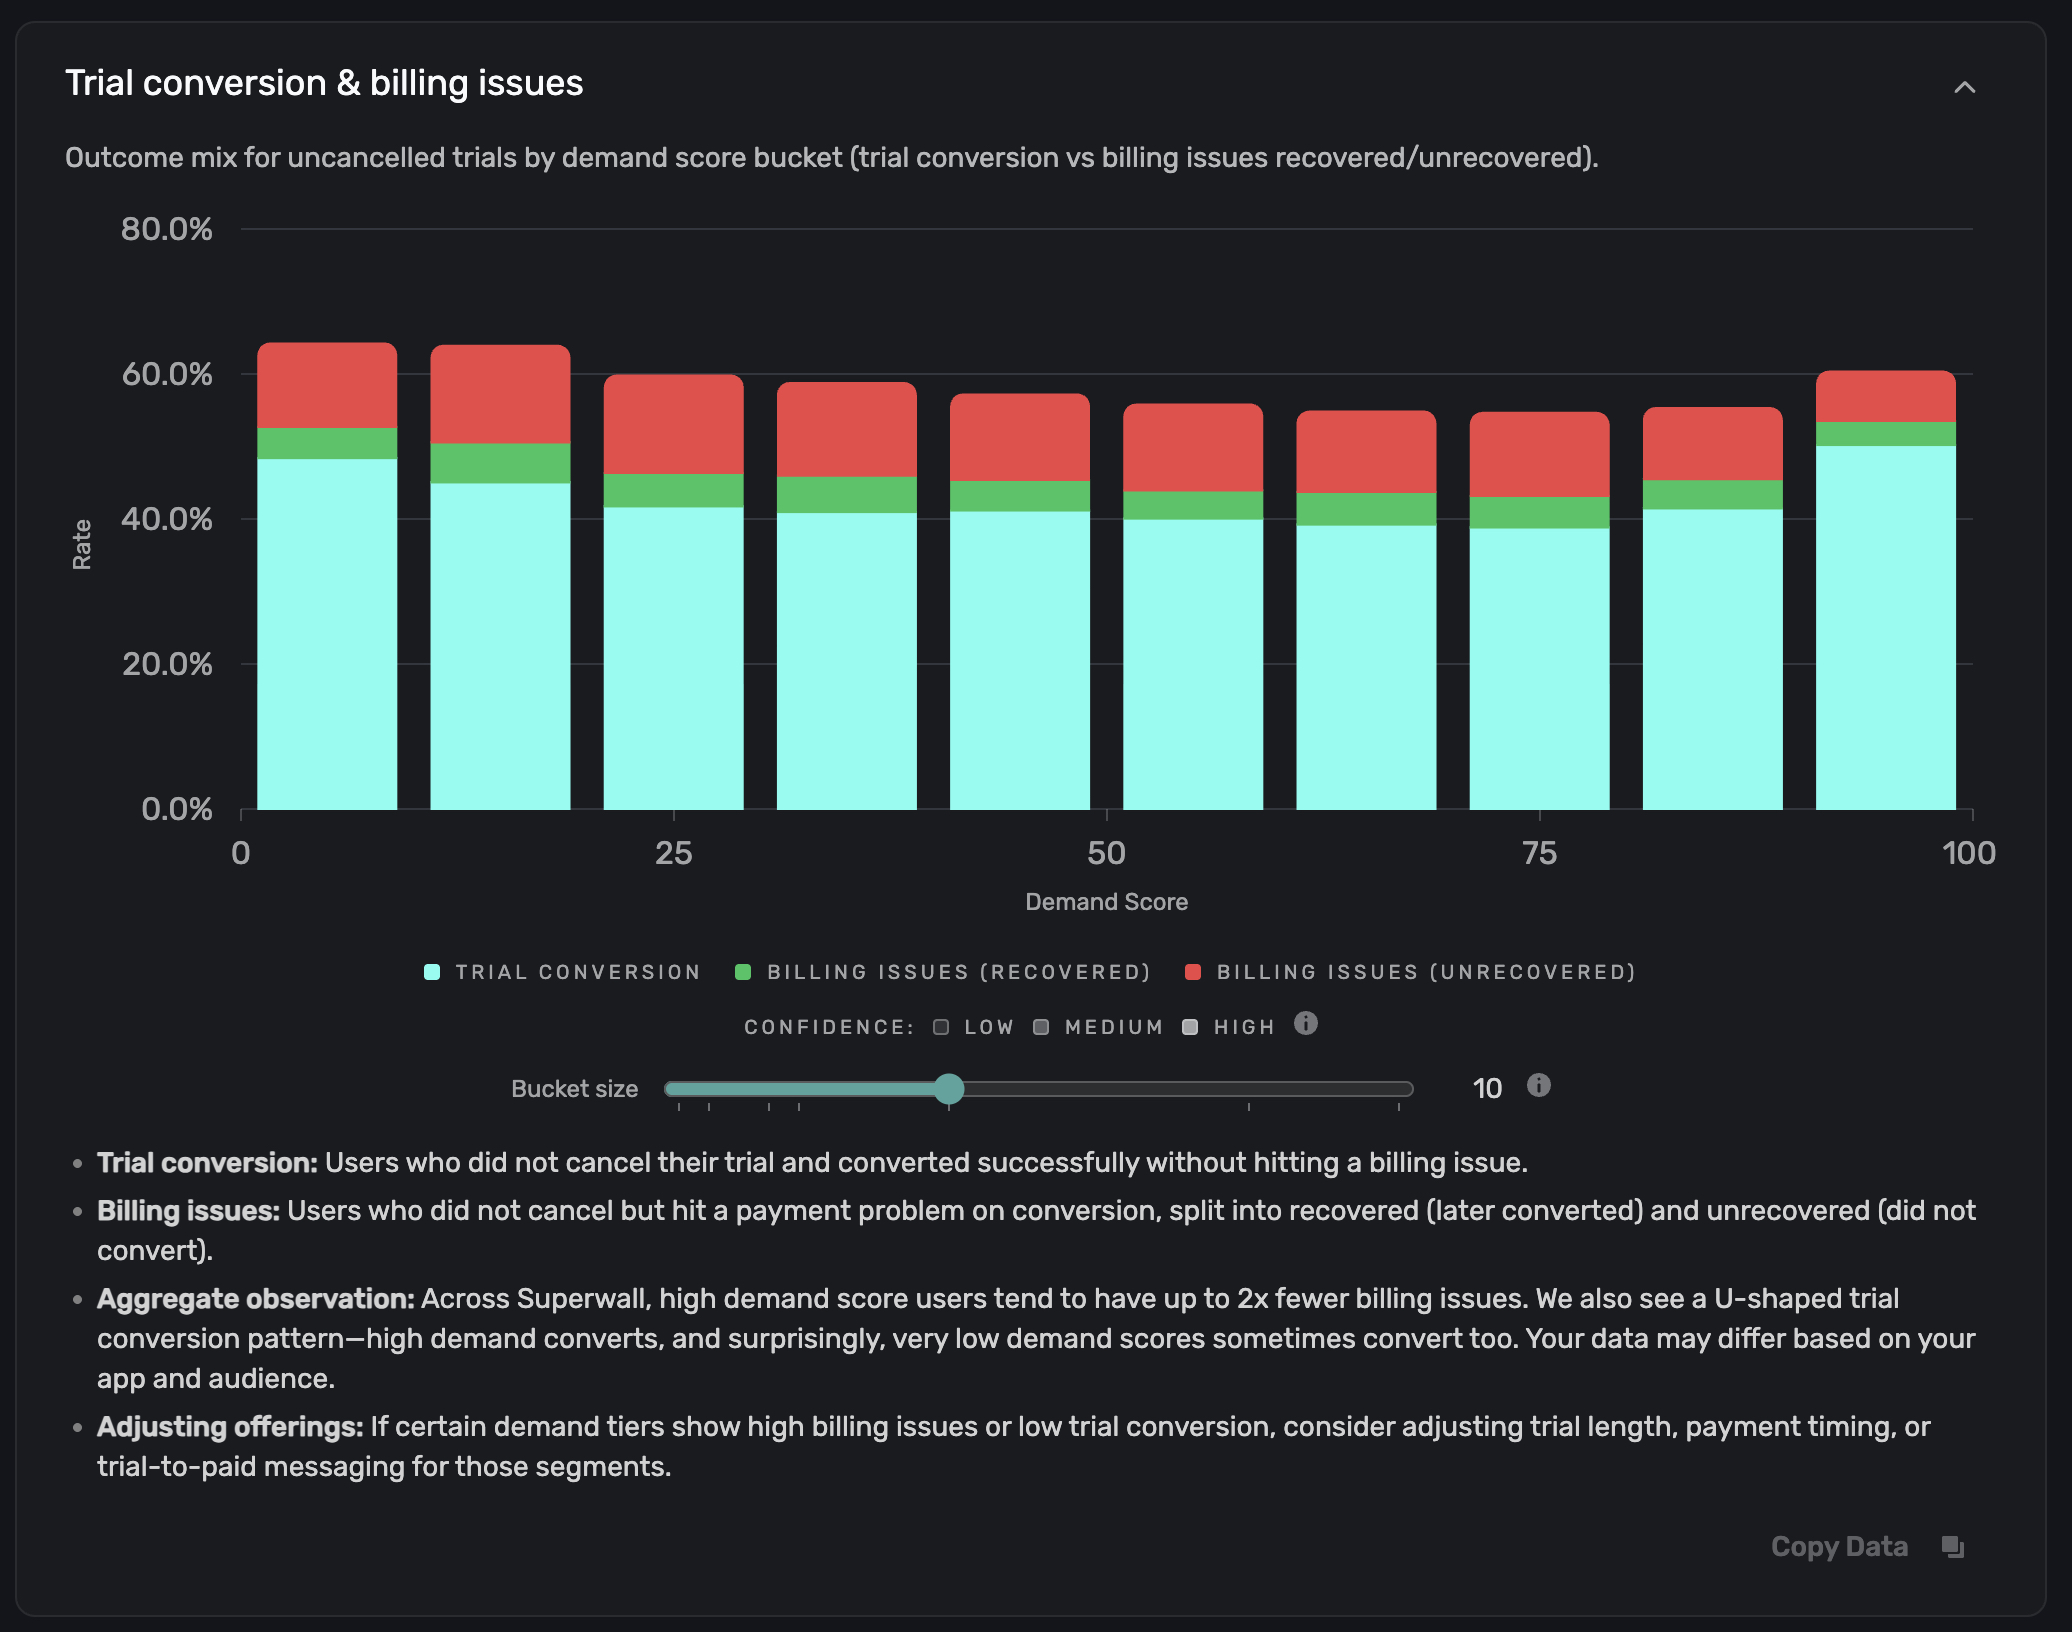
Billing failures rarely distribute evenly.
For many apps, they spike below a certain score threshold. That often signals a mismatch between trial structure and actual intent.
One pattern we see regularly: billing failures look normal at scores 80 and above, then jump sharply around 75 and below.
The instinct is to fix the trial experience.
But the right experiment is often different — test paid trials, or direct subscriptions without a trial for that segment.
The free trial wasn't the problem. Offering it to users who weren't ready was.
4. Breakdown by placement and country
A placement with high-intent users but low conversion usually points to a paywall or offer mismatch — not a user quality issue.
Demand Score makes that distinction visible.
The same applies to markets. Two countries can have similar demand score distributions but very different conversion rates. That's not an intent problem. That's localization or pricing fit.
There's also an AI analysis layer that surfaces patterns and recommends experiments based on your distribution. It's a useful starting point, especially when you're looking at the data for the first time.
What you can do with it
The charts are valuable on their own. The real unlock is using demandScore as a campaign audience filter.
Say your conversion chart shows a clear jump at 70.
You can create an audience targeting 70–100 and serve those users a different paywall — maybe with annual pricing front and center, less friction, and a stronger value proposition.
For users in the 30–60 range, you might test a longer trial, a lower-tier offer, or a softer introduction to the product.
Every app's distribution is different. The charts help you find your natural breakpoints instead of guessing.
You can also branch paywall flows directly on Demand Score inside the editor — no code required.
Set a rule: if the demand score is below 60, route this user to a different screen.
Because the score updates on every app open, you can build cascading experiences.
Instead of triggering discounts based on arbitrary timelines — "show a discount after Day 3" — you trigger offers based on actual intent decay.
Here's what that looks like in practice.
A user opens your app with a score of 90. High intent. You show your standard annual paywall.
They don't convert.
On the next open, their score drops to 83. Still strong, but drifting. You route them to a softer offer — perhaps highlighting monthly pricing.
They still don't convert...
By the third or fourth open, they're at 70. Then 65. A different segment entirely.
At that point, the question isn't how to push harder on the same offer. It's whether a different price structure makes sense altogether.
You define the breakpoints once. Superwall handles the routing automatically.
The goal isn't to show users a lower price. It's to show them the right offer — the one that actually matches where they are.
Getting started
If you're already on Superwall, open the Demand Score page from your dashboard sidebar.
Before running new experiments, spend a few minutes with the distribution chart. Look at where users cluster, where conversion shifts sharply, and whether billing failure patterns align with intent levels.
That's where the real experiments are hiding.
Demand Score is currently in beta. Viewing insights is available on all plans. Using Demand Score to filter campaign audiences requires the Scale plan.
Check out the full documentation → superwall.com/docs/demand-score
I've spent years watching mobile marketers — myself included — throw offers at users who weren't ready, while barely differentiating for the ones who were.
Not because we didn't care.
Because we genuinely couldn't tell the difference.
The signals are finally there. Use them to build something more precise. More useful for the people who actually open your app every day.
Cheers, from builders